
Don’t Let Numbers Scare You - A Guide To Finding and Understanding Baseball Stats
Note: This piece is only going to cover offensive statistics. I may write a companion piece for pitching stats later on.
For much of baseball history, we’ve been used to seeing things like this.

How often did a guy play? How many hits did he get per AB? Did he hit the ball out of the park much? Drive in many runs? Swipe a few bags? It’s not hard to understand why this was considered for so long to tell us much of what we needed to know about a player’s offensive contribution to his team. After all, the Triple Crown stats are there! When was the last time a player won the Triple Crown without having a great season? It’s darn near impossible.
As it happens, though, we’ve had more stats available to us for a long time that can tell us more about the type of player we’re looking at.
For the purposes of this piece, I’ll assume you understand all of Gardy’s stats up there, and we’ll build off of them.
Prologue: Counting Stats and Rate Stats
Almost all the stats that we’ll discuss here are either counting stats or rate stats. Counting stats are the stats you need to amass a ton of to make the HOF (hits, home runs, wins, strikeouts, etc.) and rate stats are the stats that tell us how often you get those things (BA, SLG, ERA, K%, etc.).
If you can’t tell if something is a counting stat or a rate stat, one easy test is to ask yourself if it’s possible for a player to lead the league in that stat without playing very much.
Hits: It’s hard to lead the league in hits if you miss half the season! Other guys have way more opportunities to amass hits than you do. Counting stat.
Batting Average: Because batting average is hits divided by at-bats, the amount a player plays does not affect his ability to run a high batting average (a player who goes 1-1 in one game leads the league in BA, for example, but is tied for second to last in hits). Rate stat.
Part 1: The Triple Slash

In the graphic above, we get all the information we’re accustomed to getting about Lamonte Wade Jr. I can hear John Sterling in my head saying “Wade comes into the game hitting .277 with 9 homers and 27 ribbies.” He loves those three stats together, and we understand them!
This graphic adds something to our toolkit though. Those three numbers separated by slashes - BA / OBP / SLG - can tell us some interesting things about Wade as a player.
As you’ll remember from the section above, BA, OBP, and SLG are all rate stats. So what rates are they describing?
You already know batting average! For every at-bat a player has, how many hits does he get? Typically, we think of a guy who gets three hits for every 10 at-bats as a great player. This normally holds up.
OBP (On Base Percentage): When I was a little kid, my grandfather asked me if I could name the seven ways to reach first base (hit, error, fielder’s choice, walk, HBP, dropped third strike, defensive interference). Given that this was before Jacoby Ellsbury, I don’t think I got the defensive interference piece right. Anyway, what we can see is that there are productive ways to get on base (namely walk and HBP) that are not included in batting average. Why is that? Well, strictly speaking, those plate appearance results are not hits, so they shouldn’t be included in BA. Still, though, shouldn’t we credit a player for having the ability to find a way to get on base? Of course we should! That’s what OBP is for. OBP is calculated by dividing the total number of hits, walks, and HBP a player has by the total number of at-bats, walks, HBP, and sacrifice flies a player has. By doing this, we can see how good a player is at simply reaching base, whether or not he does so by getting a hit.
Only nine qualified hitters in MLB last year posted an OBP of at least .400. You can think of being a .400 OBP guy as similar to being a .300 hitter. You generally won’t reach that mark without being very good.
SLG (Slugging Percentage): What’s better, a triple or a single? Intuitively, you know a triple is better. It is more likely to drive in any runners who are on base than a single is, and it makes it easier for the batter who hit it to score from the results of subsequent PA. Why, then, does batting average, which says all hits are of equal value, not realize that it’s the case? Well, much in the same way that we can’t know from a player’s OBP what kinds of events lead to him having that OBP (we can’t know from the number itself how many hits, walks, and HBP are going into it), batting average does not attempt to tell us what kinds of hits are going into its numerator. That’s why we have slugging percentage! Slugging percentage is calculated by dividing total bases by at-bats. It makes sense! In every at-bat, a player can amass 0 (out, error, FC, etc.), 1 (single), 2 (double), 3 (triple), or 4 (home run) total bases. Given that we know total bases are a good thing (Aaron, Pujols, Musial, Mays, and Bonds don’t end up as the all-time leaders in a category by accident), knowing how many total bases a player tends to amass per at-bat is helpful to us!
Attentive readers will notice that SLG is the first stat we’ve discussed that acknowledges the central insight of baseball statistics: the best thing a batter can do is hit a home run.
In 2023, 10 of 168 qualified MLB hitters slugged at least .550.
OPS (On Base Plus Slugging): OPS is the first stat we’ll address here that aims to quantify a players complete offensive contribution to his team. Batting average is nice, but it doesn’t credit a player for walking and thinks every hit is of equal value. OBP is nice, but it doesn’t tell us the relative goodness of each of the things that allowed a player to get on base. Slugging percentage is nice, but it doesn’t tell us how frequently a player gets on base. For OPS, we just add together OBP and SLG. Now we have one stat that combines how often a player gets hits, how often he gets on base by other means, and how powerful his hits are. That’s great!
When I was visiting my grandparents last summer and my grandmother and I were watching the infamous series against the Dodgers, I got to teach her about OPS, and now she loves pointing it out (she pronounces it like ‘ops’ rather than saying each letter). It still makes me laugh to think about her saying “Will! Will! Ops!” when a player with an OPS of .900 or so would come up. Here’s the scale I told her to use to think about OPS.
Under .700: Not a good hitter
.700-.750: Around average
.750-.800: Pretty good
.800s: Really good
.900s: Great
1.000s: Best in the league
And this holds up!

As you can see, OPS probably ranks these hitters in exactly the order in which you would rank them! That’s one of the great secrets of how good stats tend to work. Our eye test is often flawed, absolutely. But we generally know what makes a good hitter, and OPS does a good job of telling us that our intuition about what makes a good hitter is directionally correct.
One thing that OPS helps us see is that batting average alone is not all that informative. Luis Arraez led the league in batting average by a lot, hitting .354. But of the guys in the table above, his OPS was closest to that of Jose Ramirez. Why? Well, Arraez doesn’t walk much (so his hits make up a VERY large portion of his OBP) and extra base hits don’t make up all that large a percentage of his total hits. As a result, his SLG would slot in between Ramirez’s and Chapman’s in the table. If we only looked at BA, we never would’ve gotten that insight.
Isolated Power (ISO): The last bit of magic we’ll do with the BA / OBP / SLG triple slash is calculating ISO. ISO is a player’s batting average subtracted from his slugging percentage.
Imagine a player who only hits singles. This player’s batting average and slugging percentage would be exactly equal. Now imagine a player who only hits home runs. His slugging percentage would be exactly four times his batting average (because every time he gets a hit, it goes for four total bases). One way you can think about ISO is as the extra bases a player generates every at-bat.
If a player’s ISO is under .150, you should be concerned about his offensive ability. Of qualified hitters in MLB in 2023, the only one with an OPS over .800 and an ISO under .150 was Luis Arraez. This is because the only way to be good offensively with a very low ISO is to have a very high batting average, which is hard to do! Who led the league in ISO? Shohei Ohtani and Aaron Judge. This makes sense.
Checking In: Coming into this, you might’ve been inclined to think that a player who hits .300 is automatically better than a player who hits .250. I hope you’re beginning to see that that is not automatically true.
If the player who hits .250 walks a bunch and gets plenty of extra base hits, he might have an OBP of .400 and a SLG of .500. Suddenly we’re looking at a .900 OPS hitter. That’s a great hitter!
Our .300 hitter, on the other hand, might hardly walk or slug, producing an OBP of .350 and a SLG of .400 (the attentive among you will see that that’s a .100 ISO). His OPS is just .750, around average.
Okay, you’re doing great!
Part 2: Averages and Adjustments
One major challenge that we face when trying to compare the performances of players in different eras is that league averages change year over year. As a result, a player’s performance in a given year might be much closer to (or farther from) league average than it appears. In 1968, the so-called Year of the Pitcher, there were 89 qualified hitters in MLB. Four of those hitters, about 4.5% of the league, hit at least 35 home runs that year. In 2019, a year notorious for the use of juiced baseballs, there were 135 qualified hitters. A whopping 28 of them (!!!!) hit at least 35 home runs. That’s almost 21% of qualified hitters! That means that in 2019, it was almost five times as common for a qualified hitter to have 35 home runs as it was in 1968. I don’t know about you, but you won’t find me arguing that Joc Pederson, who hit 36 HR in 2019, had the same quality of season as Willie McCovey, who hit 36 HR in 1968 (Joc was 19th in HR among qualified hitters, McCovey was third).
As we can see, it would be really helpful to have stats that are adjusted to show us how good a player was relative to the league in a given year as opposed to just looking at the surface level stats. There’s one more important adjustment to make as well.
Mel Ott was a great hitter. When he retired, he was one of just three players in AL/NL history to reach 500 home runs, and that group would not expand until Ted Williams joined it over a decade later.
There’s a dirty secret about Mel Ott, though. 323 of his 511 career home runs came at the Polo Grounds, the only home park in which he ever played. Without question, the 258-foot distance down the line in right field aided the lefty-hitting Ott and helps explain why just 188 of his home runs came away from Coogan’s Hollow.
None of this is meant to diminish Ott’s accomplishments. He was a terrific player, a highly deserving HOFer, and our OPS test (his was .947) tells us he was a great hitter. This is meant to point out that one of the great things about baseball, that every park is different, affects what players are ultimately able to do. Would Mel Ott have hit 511 home runs if he’d played for Cincinnati? Probably not! As a result, it’s probably fair to look for stats that acknowledge the advantage that the Polo Grounds presented to Ott.
OPS+: Whenever you see a “+” in a stat, you’re looking at a stat that tells you a player’s performance relative to the league in a given year (or, for a span/career, over a given period of time). These “+ stats” always set the league average for the span you are considering at 100. This is helpful because it means we can measure how much better or worse than league average a player was in percentages. A player whose OPS+ is 150 was 50% better than league average in that span. A player whose OPS+ was 75 was 25% worse than league average. This makes OPS+ easier to understand than OPS (you don’t have to worry about .700 or .800 or whatever, you can just see how much better or worse than the league a player was). Contextualizing a player’s performance relative to the performance of the league while he was playing solves the Joc/McCovey problem we talked about. Joc’s OPS+ in 2019 was 126. McCovey’s in 1968 was 174. What’s the insight there? Runs were harder to come by in 1968 than in 2019, so the work McCovey did to produce them (even if it looked similar to what Joc did if we just look at HR) was more valuable.
In 2022, Aaron Judge’s OPS+ was 210. That’s ridiculous. Babe Ruth’s was 206 for his career. Derek Jeter’s was 115.
On top of this league/year adjustment, OPS+ is also park-adjusted. My favorite example of this park adjustment comes from Dante Bichette’s 1995 season. Bichette posted a .984 OPS. If we used the typical formula for OPS+, we’d come away with an OPS+ of about 156 for Bichette that year. OPS+ does us a helpful favor, though, and applies a park adjustment. Dante Bichette was playing at the notoriously hitter-friendly Coors Field as his home park in 1995. The Denver stadium has a famously massive outfield, creating ample opportunities for balls not to be caught by outfielders, and the thin air encourages home runs (of which Bichette hit a league-leading 40 that year). After the park adjustment, Bichette’s OPS+ that year was 130. This is still very good, basically on par with the season Jose Ramirez just had in 2023. But as we can see, we would’ve been slightly misled had we only looked at raw OPS. While Bichette was 9th in the league in OPS in 1995, he was 34th in OPS+. This is because parks matter! We’ve known this forever, and now stats allow us to zero in on exactly how much they matter.
Part 3: Wait. Weight? An Introduction to wOBA (I Was Kind of Lying Before)
We need to talk about OPS.
The OPS of a home run is 5.000 (the OBP component is 1.000, and it gets added to the 4.000 (4) total bases from a home run).
The OPS of a single is 2.000.
So to be clear, if you only consider batting average or OBP, a home run and a single are equally good. If you only consider SLG, a home run is four times as good as a single. If you only consider OPS, a home run is two and a half times as good as a single. It seems reasonable for us to ask how much better than a single (or a walk, or a double, or any other outcome) a home run really is.
Those of you who follow us on Twitter know that one of my favorite stats is wRC+ (weighted runs created plus). wRC+ works the same way that OPS+ does. Average is 100, and a player’s distance from 100 is how much better or worse than average he is. wRC+ is often very similar to OPS+ as well in its output. In 2022, Aaron Judge’s OPS+ was 210 and his wRC+ was 209. If they’re so similar, why do I prefer wRC+?
Put simply, wRC+ has a better handle on the relative value of the different results that a plate appearance can have. While OPS is locked into 1, 2, 3, or 4 total base framework that SLG requires, wRC+ is not. This is because wRC+ is based on wOBA (weighted on base average). wOBA is calculated (and Fangraphs explains it here better than I’d be able to) by considering the run values of the different outcomes of a PA, and then scaling those so they look like OBP (meaning .400 is really good). Then, just as OPS+ does with OPS, wRC+ makes wOBA even easier to understand. As you can see here, in 2023 a home run was worth about 2.27 times what a single was worth, slightly less than what OPS would tell us. The reason for this, and the main insight of wOBA, is that the simple act of getting on base is worth more than the number of total bases achieved. This extra precision is a good reason to prefer wRC+ to OPS+.
Honestly, this section was a lot simpler than I was worried it would be. Basically, if you’re willing to buy the way OPS+ works, you should buy wRC+.
Part 4: Context Matters (Sometimes)
Knowing the sum total of a player’s production (how many home runs he has, what average he has hit for over the course of the season, his current wRC+) can be helpful. Over a large enough sample, it’s darn near impossible to end up with the numbers you end up with by accident. So yeah, when Aaron Judge comes to the plate with a 165 career wRC+, you’re justified in thinking “hey, this guy is probably pretty freakin’ good.” With that said, sometimes we want to be more granular. How does a player tend to perform in a specific park? Against pitchers of a particular handedness? While hitting in a specific spot in the lineup? All of these are interesting questions (they might not all have sufficient sample sizes to be informative, but that’s a separate issue), and the various baseball stats websites present a few different ways we can find the answers to them.
Typically, we refer to these specific, situational stats as “splits.” One split with which you’re likely familiar, given that you’re watching baseball in the post-Casey Stengel era, is the platoon split. How does a hitter perform against pitchers of the opposite handedness? Typically, this matchup is advantageous for the hitter. This is also where the term “reverse splits” comes from. A player with reverse splits (like Trent Grisham) hits pitchers of his same handedness better than he hits pitchers of the opposite handedness. This is not all that common.
So where can you find splits? If we visit Aaron Judge’s page on Baseball Reference, we can see there is a tab for splits that we can select before scrolling down to see his stats.

Upon selecting that tab, you’ll be prompted to choose if you want to view Judge’s splits for a given year, or over the entirety of his career. For this exercise, I’ll use his career splits.

The page that loads is long and almost infinitely scrollable, so Baseball Reference has been kind enough to provide these helpful links to allow you to jump to a given split. If I want to find Aaron Judge’s stats at Wrigley Field, I can click on “Ballparks” and jump down the page to find his stats at every ballpark in which he’s played in the Big Leagues.

So we can see he has not been very good at Wrigley Field, though he’s only had 13 plate appearances there.
Baseball Reference’s player splits pages are quite good and can answer a lot of the typical splits-related questions you might have about a player (as they should). What if you don’t just want information about one particular player, though? That’s where Fangraphs and their Splits Leaderboards come in.

From here, I can choose “Quick Splits” to find answers to common questions about platoon and home/away splits, or I can enter the full Splits Tool by clicking “Splits.”
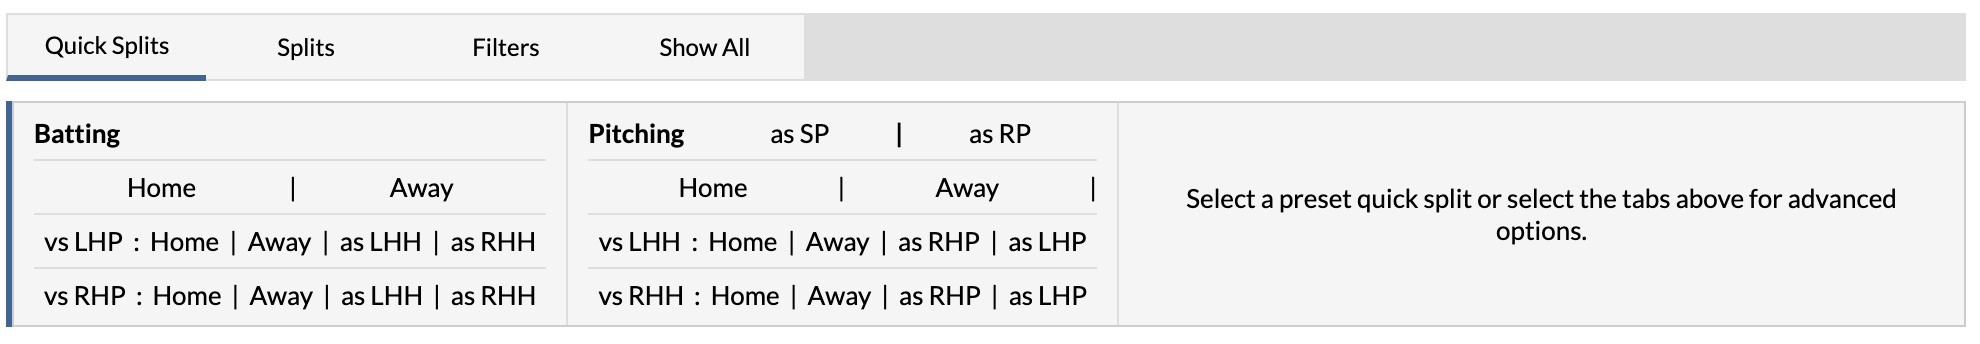
In the full Splits Tool, we can see a lot more granularity.

Let’s say I want to find out who the best hitters were in 2023 when hitting at home as LHB against LHP. As I select these splits from “Handedness” and “Home/Away” they’ll populate underneath the tool with an automated PA filter (this can be changed in the “Filters” tab).

Hit “Update,” scroll down, and see the leaderboard you’ve created (the PA limit will auto-update after you create the leaderboard. Guys are not getting 280 lefty/lefty PA).

There you have it – the best lefty/lefty hitters by wRC+ in 2023.
Anthony Rizzo’s penchant for running crazy reverse splits will never fail to amaze me (small sample).
You guys ever heard of Juan Soto? I think that guy’s pretty good.
You can access this same Splits Tool on any player’s Fangraphs player page in case you don’t want to sift through a leaderboard to find a specific player’s stats.
Part 5: Luck
Whether we like it or not, there’s more than a little bit of luck involved in baseball (I normally do not like it). A pitcher can execute a pitch well, induce weak contact, and have a ground ball sneak through the infield for a walk-off hit. A batter can hit a ball harder than anyone has in history and have it fly directly into a fielder’s glove. In both cases, a player did exactly what he ought to do (create weak contact, hit the ball hard) and got nothing for it.
Thinking about this from the batter’s perspective, why is it important to hit the ball hard? Well, a ball that’s hit hard is harder for fielders to reach, and therefore more likely to end up a hit. Additionally, a ball that’s hit hard and in the air is more likely to have the momentum to go over the fence, resulting in the best kind of hit (a home run). As we know, though, not every hard-hit ball ends up resulting in a hit. So let’s talk about luck.
Batting Average on Balls In Play (BABIP): The easiest way to think about BABIP is to think that it tells you what a player’s batting average is every time he hits a ball that could be fielded, which is to say excluding home runs and strikeouts.
Every year since 2017, the league has had a BABIP between .290 and .300. In 2023, it was .297.
Only one player outside of 2020 has hit over .400 on balls in play since 2017, and that was Yoan Moncada’s .406 in 2019. Moncada has hit .322 on balls in play since then, because hitting .400 on balls in play doesn’t last.
A few things influence BABIP. A major one is the type of batted ball. In 2023, line drives had a .708 BABIP. Fly balls, on the other hand, had a .231 BABIP. The vast majority of fly balls that don’t leave the yard get caught. Ground balls had a similarly low BABIP at .243. So, as we can see, if you’re going to hit a ball in play, you should want it to be a line drive. As a result, hitters with high line drive rates like 2018 Freddie Freeman (highest LD% of any player since 2017 with at least 400 PA in that season) can run what appear to be crazy high BABIP numbers. Freeman’s BABIP in 2018 was .358.
Another factor that affects BABIP is exit velocity. In 2023, hard-hit balls (at least 95 MPH off the bat) had a BABIP of .502, whereas softly-hit balls had a BABIP of .186. Hitting the ball hard is a good thing.
If you see a player running a crazy high BABIP, you should expect that his stats are about to decline. On July 9, 2023, Ezequiel Duran was hitting .308/.344/.526 for a 134 wRC+. That’s awesome! Through that point, only 21 hitters with at least 250 PA had a higher wRC+ than Duran on the season. If we look under the hood, though, there was some concerning stuff. His BABIP was an unbelievably high .381, 8th-highest among players with at least 250 PA. On top of that, his line drive rate and hard-hit rate were nothing special. Given those characteristics (a super high BABIP without doing things that should result in a super high BABIP), we could reasonably expect Duran’s production to fall off… and it did.
Over the course of the rest of the season, Duran hit .226/.295/.314 with a comparatively paltry .321 BABIP, tanking his production and ultimately leading the Rangers to leave him off the playoff roster.
The moral of the story is that when you see a very high BABIP, you should be skeptical. Jarren Duran was another great example of this from the 2023 season. Maybe it’s something about guys named Duran.
In 2023, the Yankees were dead last in BABIP (by a lot) even though they were 8th in hard-hit rate and ranked ahead of playoff teams like Tampa and Milwaukee in line drive rate. That’s an unusual result!
Part 6: x-Stats, The Luck Corollary
With the advent of Statcast in 2015, we fans were immediately able to know a lot more about every pitch and batted ball in every MLB game. If you have the Baseball Savant game feed running while you watch a game, you can see the velocity, spin, break, and location of every pitch, as well as the exit velocity, launch angle, and distance of every batted ball. It’s really cool!
One item you’ll notice on the game feed is xBA, which refers to expected batting average. The question xBA answers is “over a large sample, if I keep hitting the ball with that launch angle and that exit velocity, how often should I expect to get a hit?”
Naturally, for hard-hit line drives, xBA is high. For softly hit ground balls, xBA is low.
You can find a player’s total xBA on his Fangraphs player page by scrolling to the “Statcast” section. If a player’s xBA is much lower than his actual batting average, it is safe to assume he’s getting lucky. Balls that should normally be outs are ending up as hits for him for some reason. If a player’s xBA is much higher than his actual batting average, it is safe to assume he’s getting unlucky. He’s hitting the ball hard at optimal angles, but he’s not getting many hits to show for it.
xBA isn’t perfect, especially in that it does not consider direction (a fly ball pulled down the line doesn’t need to go as far to become a home run as the same fly ball hit to dead center field), but it is still a good directional indicator to us of whether or not a player is hitting the ball solidly often.
xBA’s more precise cousin is xwOBA (expected weighted on base average). Just as wOBA tries to be more precise than OPS by finding the true run values of different PA outcomes, xwOBA tries to be more precise than xBA by going beyond the question of “should this ball have been a hit or not” to the question of “what kind of hit should this ball have been?”
Like xBA, xwOBA is based on exit velocity and launch angle. People who tend to hit the ball really hard in the air like Aaron Judge tend to post a high xwOBA. Guys who post a high xwOBA over a large sample tend to post a high wOBA over a large sample (because luck has a harder time working against you over a large enough sample), and as we know, a high wOBA means a high wRC+.
If you see a guy with a high wRC+ but an xwOBA that is much lower than his actual wOBA, you should expect his actual wOBA (and therefore his wRC+) to come down.
I like to use the x-stats as a directional indicator of if a player is getting lucky or unlucky. “This player’s xBA is .275 so we should expect his batting average to end up being .275” is less interesting to me than “guys with a .250 xBA don’t hit .330 for very long, let’s see what this guy’s production falling off looks like.”
Part 7: WAR, What Is It Good For?
That joke isn’t funny when the Boomers who hate any stat DiMaggio didn’t know make it, and it’s not funny when I make it either.
Wins Above Replacement (WAR) is complicated for a few reasons, but we’re going to break it down and make it easy enough to understand.
The central insight of WAR is that wins are the result of runs. Players can create (or destroy) runs at the plate and on the bases, and they can save (or allow) runs in the field. When we sum up the runs a player has been worth to a team and then divide that by the number of runs that constitutes one win, we get WAR. In their WAR summary article, Fangraphs uses the table below to explain what kind of player should be associated with each WAR total.

Aaron Judge had 11.6 Fangraphs WAR in 2022. Pretty dang good!
A couple of notes about WAR.
First, WAR is positionally-adjusted. WAR recognizes that a very good defensive centerfielder, catcher, or shortstop, has done a hard job very well, and gives them a little boost. On the other hand, WAR subtracts runs from first basemen, corner outfielders, and designated hitters because those positions are easier (or nonexistent) defensively. This positional adjustment allows us to use WAR to compare players who play different positions.
Second, there are a few different calculations of WAR. The two major ones are Fangraphs WAR (fWAR) and Baseball Reference WAR (bWAR or rWAR depending on who you ask). For position players, fWAR and bWAR use different defensive stats to arrive at their WAR values. This shows us that WAR is not a perfect tool for quantifying how valuable a player is, and that there’s room for debate about how that calculation would work. In the long run, though, the sites tend to get pretty close to one another. They differ by 0.3 (41.5 versus 41.8) in their evaluation of Aaron Judge’s career.
Third, don’t get hung up on “above replacement.” Wally Pipp did not get a WAR penalty for playing in front of Lou Gehrig. It is not about a specific player’s replacement on the depth chart, but rather about a “replacement level” of production. The replacement level of production is the production a team would expect to get from a fringe MLB guy, a “AAAA” player, if you will.
WAR has been internally consistent in that regard, as you can read here. The criticism of WAR that it rates a player’s performance “relative to some hypothetical guy” falls apart when you find that the real-life versions of that “hypothetical guy” tend to combine to produce about 0 WAR.
Part 8: Putting It All Together
There are three questions answered by the stats we’ve discussed here. The first is “what do we know about this player’s performance?” The second is “why is that player performing the way he is?” The last is “what do we think will happen to that player’s performance in the future?”
The bottom line is that results-based stats like BA, OBP, SLG, wRC+, and WAR do a good job of telling us how a player has performed, but we have to ask what is going into those stats (is the player running an unsustainably high BABIP, is the player getting unlucky, etc.) to develop reasonable opinions on how that player will perform in the future.
I hope you learned something from this piece, and that you’re better prepared to contribute to baseball discourse today than you were yesterday. Don’t hesitate to reach out to us on Twitter if you have questions about anything in here, or if there are things we didn’t cover that you’d like us to!